Plotly.NET.Interactive 2.0.0
A .NET Interactive Kernel Extension for displaying Plotly.NET charts.
No packages depend on Plotly.NET.Interactive.
Plotly.NET finally has reached all milestones for 2.0 and is ready for a stable release.
This release is the culmination of almost **2 years of work in >500 commits by 17 contributors**.
Here is an attempt to visualize the history of these changes in a few seconds:

(made with [gource](https://github.com/acaudwell/Gource))
All APIs have changed significantly - this release is incompatible with 1.x and many 2.x-preview/beta versions.
TL;DR**
- All plotly chart/trace types!
- Unified API!
- chart rendering in notebooks!
- programmatic static image export!
- Exhaustive docs!
- We have a [discord server](https://discord.gg/k3kUtFY8DB), feel free to ask questions there!
Core library**
General**
- The API layer model has refined and used for every type of plotly object abstraction. In brief,
- There are 5 main categories of abstractions: `Trace` (chart data and type), `Layout`(non-data chart styling), `Config`(render options), `DisplayOptions`(html display options), `StyleParam`(DSL for styling options)
- Many properties used in these levels are themselves objects, which are in the respective `*Objects` namespace (e.g. `Geo`, which determines map layout of geo traces is an object on the `Layout` and therefore in the `LaoutObjects` namespace.)
- every object is based on `DynamicObj` and its properties can therefore be further customised by dynamic member assignment. Therefore, every plotly property can be set manually, even those which do not have direct abstractions.
- There are now several `Trace` types for each kind of subplot (`Trace2D`, `Trace3D`, etc.) and eqivalent `Chart` types (`Chart2D`, `Chart3D`, etc). while not visible from the top level api (everything kan be accessed via the unified `Chart` API), this greatly improves correct multi chart layouting.
- There are 3 ways of creating charts with increasing level of customization:
1. The `Chart` API as a unified API surface for chart creation and styling
- `Chart.<ChartType>` (e.g. `Chart.Point`) for chart creation from data and some chart specific styling options
- `Chart.with<Style or object>` (e.g. `Chart.withXAxisStyle`) for styling of chart objects
2. Creation of Chart objects by manually creating `Trace`, `Layout` and `Config` objects with many more optional customization parameters
3. Exclusive usage of `DynamicObj` - you can translate **any** plotly.js javascript with this method.
Chart/Trace abstractions**
You can create the following Charts with Plotly.NET's API (and many more by combining them):
- Cartesian 2D (`Chart2D`):
- `Scatter` (Point, Line, Spline, Bubble, Range, Area, SplineArea, StackedArea)
- `Funnel`
- `Waterfall`
- `Bar` (Bar, Column, StackedBar, StackedColumn)
- `Histogram`
- `Histogram2D`
- `Histogram2DContour`
- `PointDensity`
- `BoxPlot`
- `Violin`
- `Heatmap` (Heatmap, AnnotatedHeatmap)
- `Image`
- `Contour`
- `OHLC` (OHLC, CandleSticks)
- `Splom`
- Cartesian 3D (`Chart3D`):
- `Scatter3D` (Point3D, Line3D, Bubble3D)
- `Surface`
- `Mesh3D`
- `Cone`
- `StreamTube`
- `Volume`
- `IsoSurface`
- Polar (`ChartPolar`):
- `ScatterPolar` (PointPolar, LinePolar, SplinePolar, BubblePolar)
- `BarPolar`
- Maps (`ChartMap`):
- `ChoroplethMap`
- `ChoroplethMapbox`
- `ScatterGeo` (PointGeo, LineGeo, BubbleGeo)
- `ScatterMapbox` (PointMapbox, LineMapbox, BubbleMapbox)
- `DensityMapbox`
- Ternary (`ChartTernary`):
- `ScatterTernary` (PointTernary, LineTernary, SplineTernary, BubbleTernary)
- Carpet (`ChartCarpet`):
- `Carpet`
- `ScatterCarpet` (PointCarpet, LineCarpet, SplineCarpet, BubbleCarpet)
- `ContourCarpet`
- Domain (`ChartDomain`)
- `Pie` (Pie, Doughnut)
- `FunnelArea`
- `Sunburst`
- `Treemap`
- `ParallelCoord`
- `ParallelCategories`
- `Sankey`
- `Table`
- `Indicator`
- `Icicle`
- Smith (`ChartSmith)`
- `ScatterSmith` (PointSmith, LineSmith, BubbleSmith)
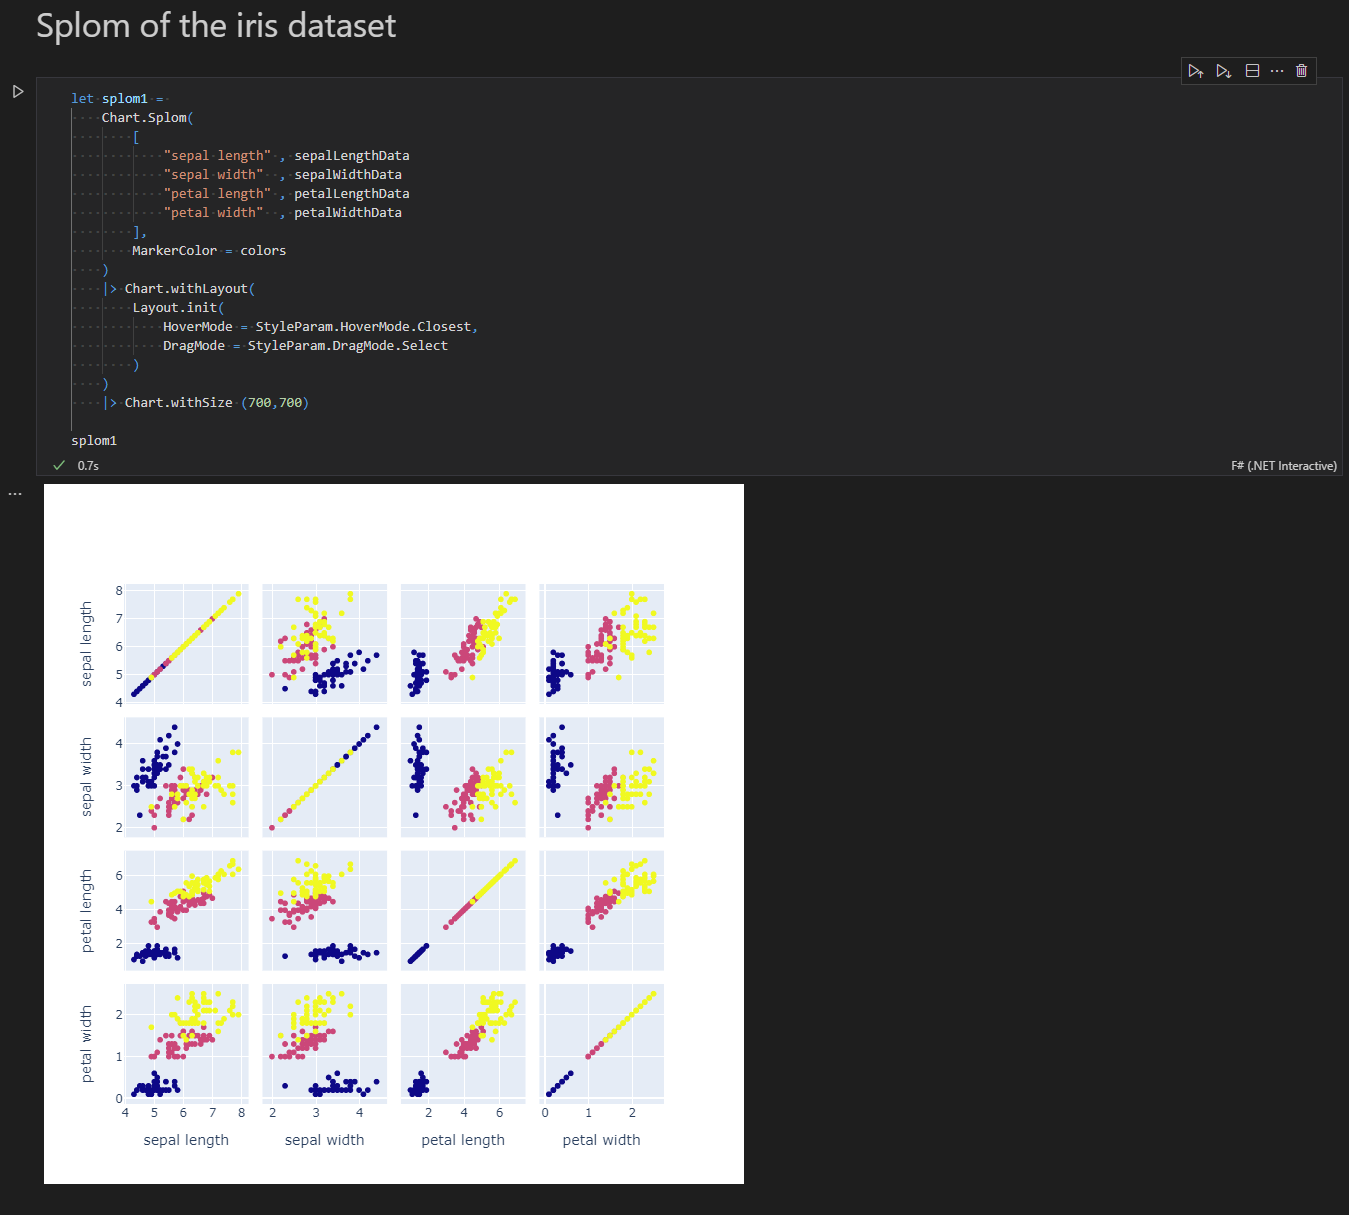
Plotly.NET.Interactive**
You can directly render charts as html cell output with the dotnet interactive kernel:
Plotly.NET.ImageExport**
This library provides an interface for image rendering engines to consume plots and create static image files (PNG, JPG, SVG), as well as a reference implementation using [PuppeteerSharp](https://github.com/hardkoded/puppeteer-sharp) to render charts with headless chromium.
.NET Standard 2.1
- Plotly.NET (>= 2.0.0)
- FSharp.Core (>= 6.0.2)
- Microsoft.DotNet.Interactive (>= 1.0.0-beta.22175.2)
- Microsoft.DotNet.Interactive.Formatting (>= 1.0.0-beta.22175.2)
| Version | Downloads | Last updated |
|---|---|---|
| 6.0.0-preview.1 | 1 | 2025/11/15 |
| 5.0.0 | 2 | 2025/9/16 |
| 4.2.1 | 1 | 2025/11/11 |
| 4.2.0 | 1 | 2025/11/11 |
| 4.1.0 | 1 | 2025/11/11 |
| 4.0.0 | 1 | 2025/11/11 |
| 4.0.0-preview.1 | 1 | 2025/11/15 |
| 3.0.2 | 1 | 2025/11/11 |
| 3.0.1 | 1 | 2025/11/11 |
| 3.0.0 | 1 | 2025/11/11 |
| 2.0.0 | 1 | 2025/11/11 |
| 2.0.0-preview.18 | 1 | 2025/11/10 |
| 2.0.0-preview.17 | 1 | 2025/11/10 |
| 2.0.0-preview.16 | 1 | 2025/11/10 |
| 2.0.0-preview.15 | 1 | 2025/11/10 |
| 2.0.0-preview.14 | 1 | 2025/11/10 |
| 2.0.0-preview.13 | 1 | 2025/11/9 |
| 2.0.0-preview.12 | 1 | 2025/11/9 |
| 2.0.0-preview.11 | 1 | 2025/11/9 |
| 2.0.0-preview.10 | 1 | 2025/11/9 |
| 2.0.0-preview.9 | 1 | 2025/11/15 |
| 2.0.0-preview.8 | 1 | 2025/11/15 |
| 2.0.0-preview.7 | 1 | 2025/11/15 |
| 2.0.0-preview.6 | 1 | 2025/11/15 |
| 2.0.0-preview.5 | 1 | 2025/11/15 |
| 2.0.0-preview.4 | 1 | 2025/11/15 |
| 2.0.0-preview.3 | 1 | 2025/11/15 |
| 2.0.0-preview.2 | 1 | 2025/11/15 |
| 2.0.0-preview.1 | 1 | 2025/11/15 |
| 2.0.0-beta9 | 1 | 2025/11/15 |
| 2.0.0-beta8 | 1 | 2025/11/15 |
| 2.0.0-beta7 | 1 | 2025/11/15 |
| 2.0.0-beta6 | 1 | 2025/11/15 |
| 2.0.0-beta5 | 1 | 2025/11/15 |
| 2.0.0-beta4 | 1 | 2025/11/15 |
| 2.0.0-beta10 | 1 | 2025/11/8 |
| 2.0.0-beta.10 | 1 | 2025/11/10 |
| 2.0.0-alpha5 | 1 | 2025/11/15 |
| 2.0.0-alpha4 | 1 | 2025/11/15 |